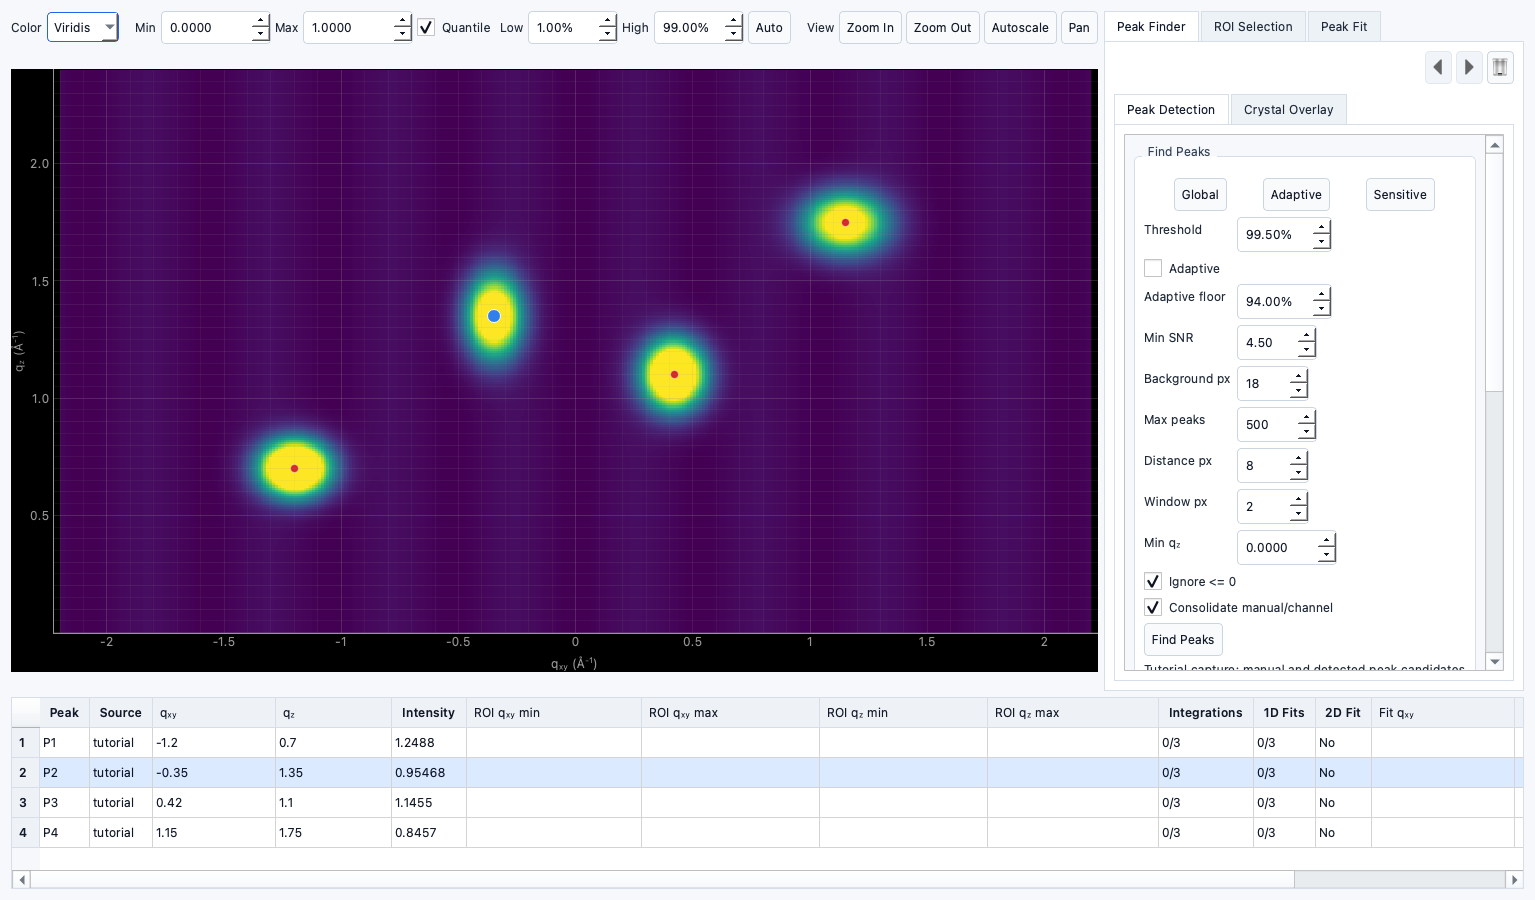
Peak Identification
Documentation notice
This documentation was generated with help from a large language model and has not been fully vetted by the developer. Verify critical details against the source code and current application behavior.
Peak Identification connects visual markers with data regions and prepares peaks for fitting.
Manual point placement
- Single-click in the Peak Identification image plot to place a point.
- Use table editing to correct IDs and source metadata.
Channel plots
- View channels for current ROI-associated points and adjust their source context.
Dragging and editing points
- Drag points directly on the plot.
- Edits are reflected in the active peak list.
Snapping points to maxima
- Peak points can be snapped to local maxima where available.
Symmetry checking
- Symmetry checks evaluate mirrored positions and report unmatched relationships when expected symmetry is broken.
Detector/mask gap handling
- Gap regions and mask interactions are preserved in point and ROI context.
Undo/redo
- Undo/redo workflows are available for major point actions.
Import/export peak sets
- Peak points can be imported from saved source records in project state.
- Export is supported through project save; CSV export utilities are in active workflows and depend on current project output paths.
Channel integration handoff
- Peak points created here become candidates for ROI-based integration and fit.
Notes
- Full standalone text exports for selected peak sets are on the planned/experimental path and may appear as plugin-specific outputs in future releases.